Launching the GUI
In order to use this viewer you will need to know a bit of spikeinterface documentation
Step 1: create and compute SortingAnalyzer
You first need to get a SortingAnalyzer object with spikeinterface.
See help here
Note that:
some extensions are mandatory (unit_location, templates, )
some extensions are optional
the more extensions are computed the more views are displayed
Example:
import spikeinterface.full as si
recording = si.read_XXXX('/path/to/my/recording')
recording_filtered = si.bandpass_filter(recording)
sorting = si.run_sorter('YYYYY', recording_filtered)


job_kwargs = dict(n_jobs=-1, progress_bar=True, chunk_duration="1s")

# make the SortingAnalyzer with necessary and some optional extensions
sorting_analyzer = si.create_sorting_analyzer(sorting, recording_filtered,
                                              format="binary_folder", folder="/my_sorting_analyzer",
                                              **job_kwargs)
sorting_analyzer.compute("random_spikes", method="uniform", max_spikes_per_unit=500)
sorting_analyzer.compute("waveforms", **job_kwargs)
sorting_analyzer.compute("templates", **job_kwargs)
sorting_analyzer.compute("noise_levels")
sorting_analyzer.compute("unit_locations", method="monopolar_triangulation")
sorting_analyzer.compute("isi_histograms")
sorting_analyzer.compute("correlograms", window_ms=100, bin_ms=5.)
sorting_analyzer.compute("principal_components", n_components=3, mode='by_channel_global', whiten=True, **job_kwargs)
sorting_analyzer.compute("quality_metrics", metric_names=["snr", "firing_rate"])
sorting_analyzer.compute("template_similarity")
sorting_analyzer.compute("spike_amplitudes", **job_kwargs)
Step 2: open the GUI for one analyzer
With python:
from spikeinterface_gui import run_mainwindow
# reload the SortingAnalyzer
sorting_analyzer = si.load_sorting_analyzer("/my_sorting_analyzer")
# open and run the Qt app
run_mainwindow(sorting_analyzer, mode="desktop", curation=False)
# open and run the Web app with curation activated
run_mainwindow(sorting_analyzer, mode="web", curation=True)
Or from spikeinterface:
import spikeinterface.widgets as sw
sorting_analyzer = load_sorting_analyzer(test_folder / "sorting_analyzer")
sw.plot_sorting_summary(sorting_analyzer, backend="spikeinterface_gui")
With the command line
sigui /path/for/my/sorting_analyzer
The command line supports some options like –no-traces or –curation or –mode
sigui --mode=web --no-traces --curation /path/for/my/sorting_analyzer
Running with curation mode
To open the viewer with curation mode use curation=True.
from spikeinterface_gui import run_mainwindow
run_mainwindow(sorting_analyzer, curation=True)
import spikeinterface.widgets as sw
sw.plot_sorting_summary(sorting_analyzer, curation=True, backend="spikeinterface_gui")
The curation_dict can be saved inside the folder of the analyzer (for “binary_folder” or “zarr” format). Then it is auto-reloaded when the gui is re-opened.
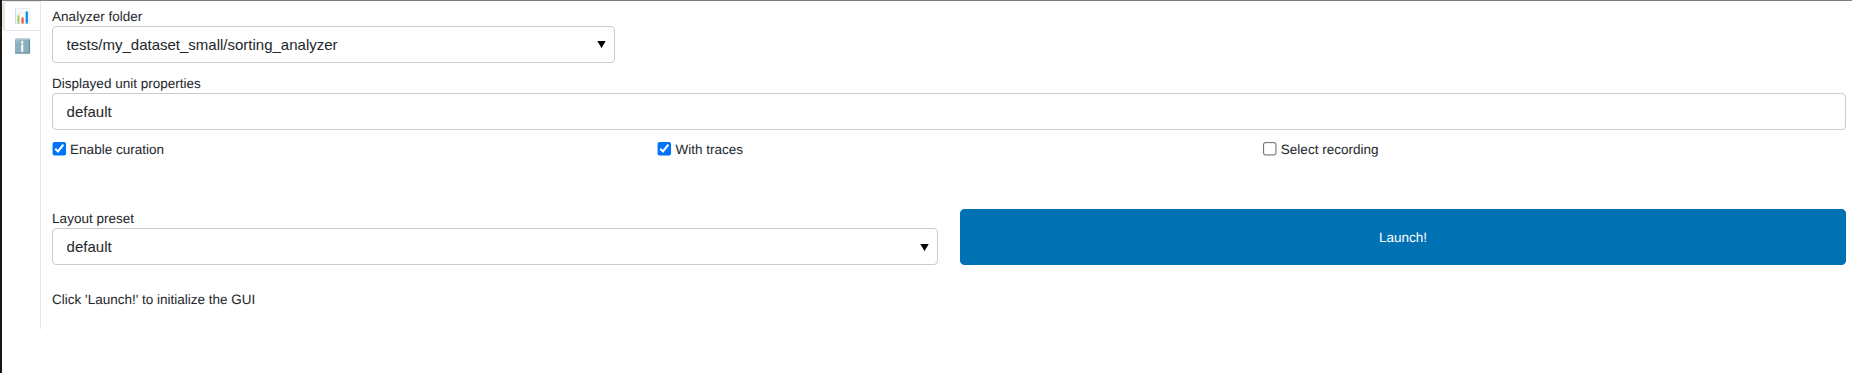
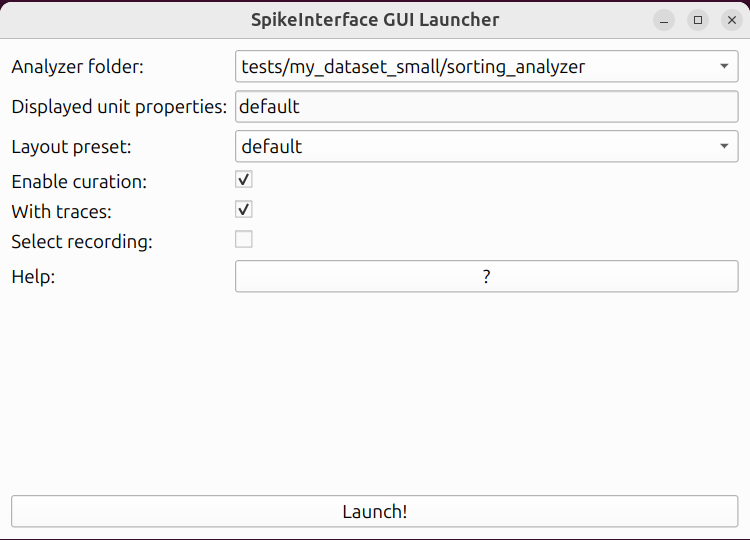
Open the GUI launcher
If you have multiple analyzer folders in the same root folder (or in subfolders), you can use the GUI launcher to select which one to open.
from spikeinterface_gui import run_launcher

run_launcher(root_folder="path-to-my-analyzers", mode="desktop")
You can also use the command line and just specify the --root-folder:
sigui --mode=desktop --root-folder path-to-my-analyzers
sigui --mode=web --root-folder path-to-my-analyzers