Views
This page documents all available views in the SpikeInterface GUI, showing their functionality and appearance across different backends (desktop Qt and web panel).
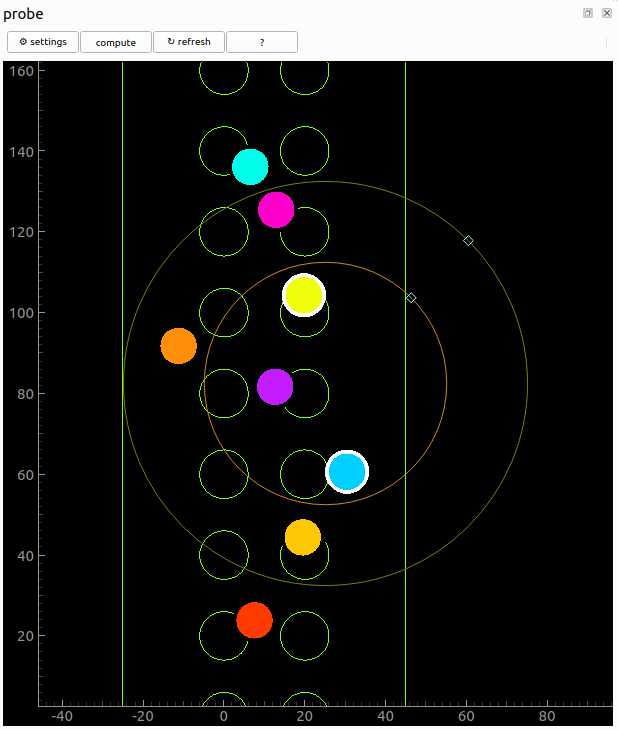
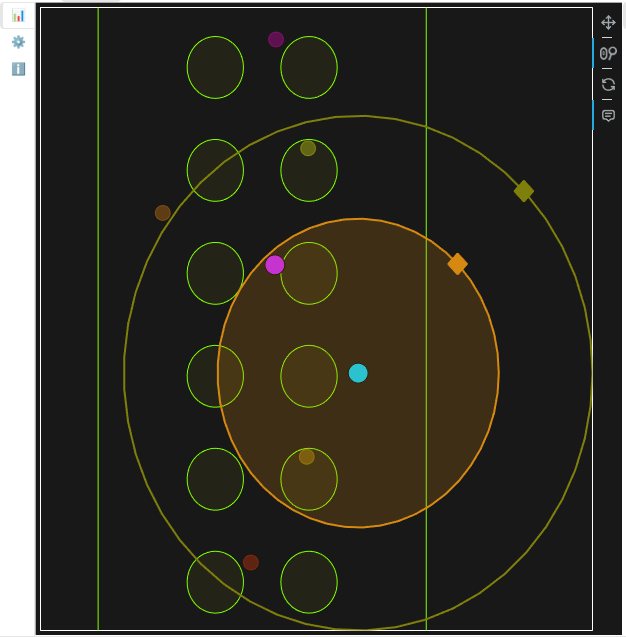
Probe View
Show contact and probe shape. Units are color coded.
Controls
left click : select single unit
ctrl + left click : add unit to selection
mouse drag from within circle : change channel visibility and unit visibility on other views
mouse drag from “diamond” : change channel / unit radii size
Screenshots
Desktop (Qt) |
Web (Panel) |
|---|---|
|
|
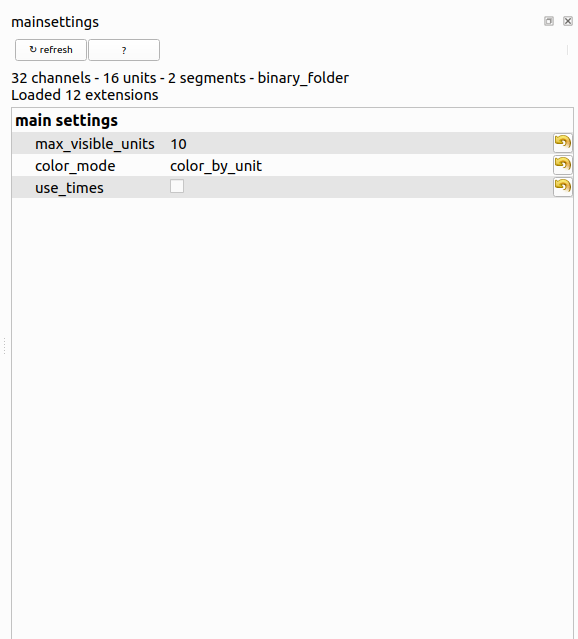
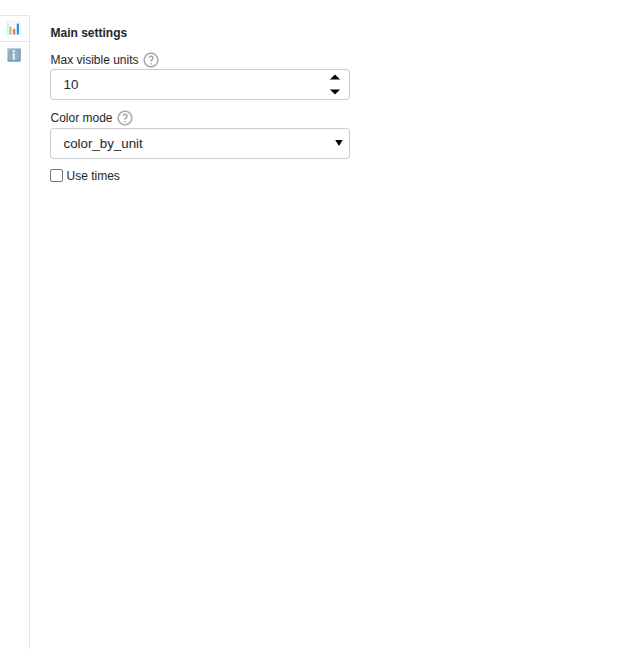
Main settings
Overview and main controls. Can save current settings for entire GUI as the default user settings using the “Save as default settings” button.
Screenshots
Desktop (Qt) |
Web (Panel) |
|---|---|
|
|
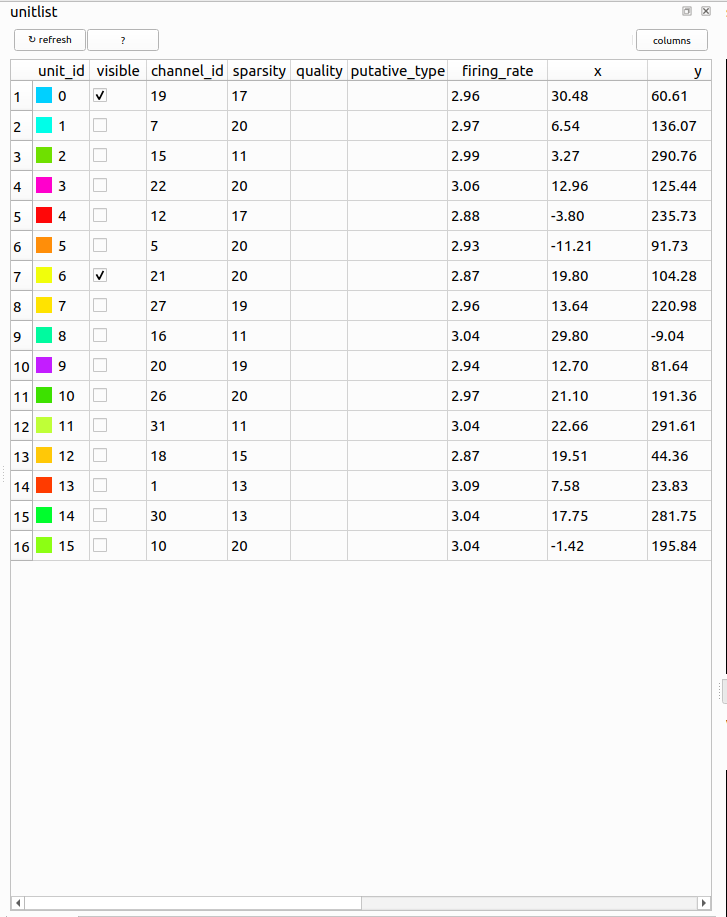
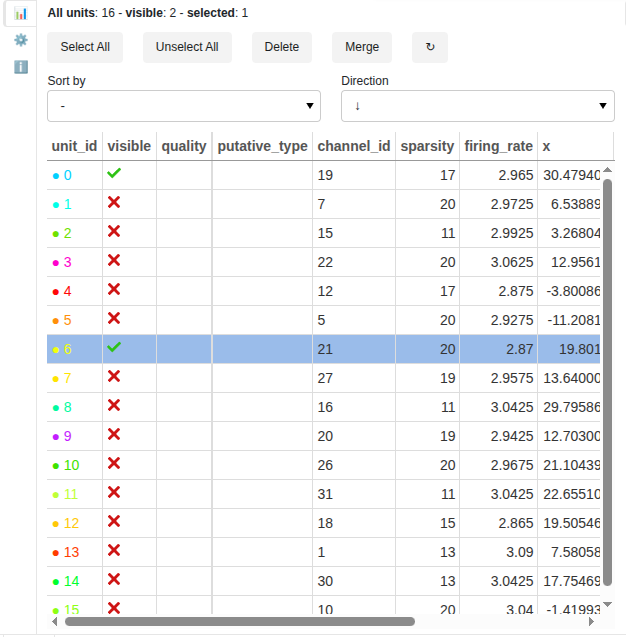
Unit List
This view controls the visibility of units.
Controls
check box : make visible or unvisible
double click : make it visible alone
space : make selected units visible
arrow up/down : select next/previous unit
ctrl + arrow up/down : select next/previous unit and make it visible alone
press ‘ctrl+d’ : delete selected units (if curation=True)
press ‘ctrl+m’ : merge selected units (if curation=True)
press ‘g’ : label selected units as good (if curation=True)
press ‘m’ : label selected units as mua (if curation=True)
press ‘n’ : label selected units as noise (if curation=True)
drag column headers : reorder columns (Qt-only)
click on column header : sort by this column (Qt-only)
“↻” : reset the unit table
Screenshots
Desktop (Qt) |
Web (Panel) |
|---|---|
|
|
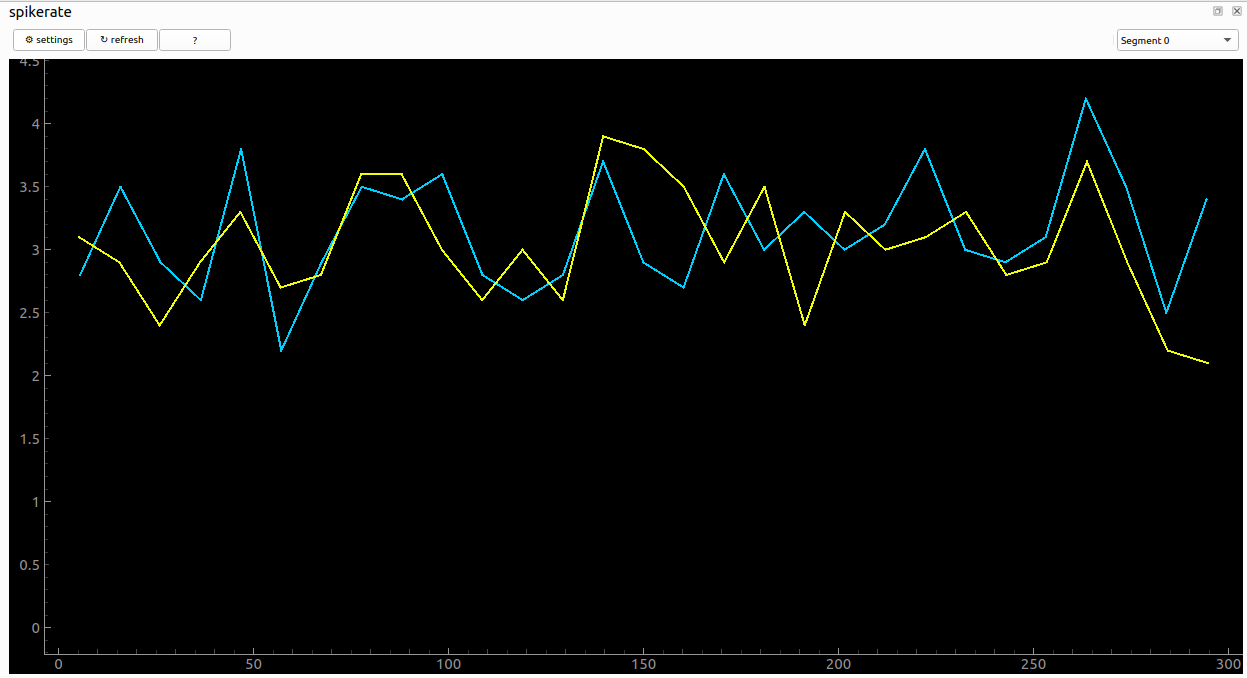
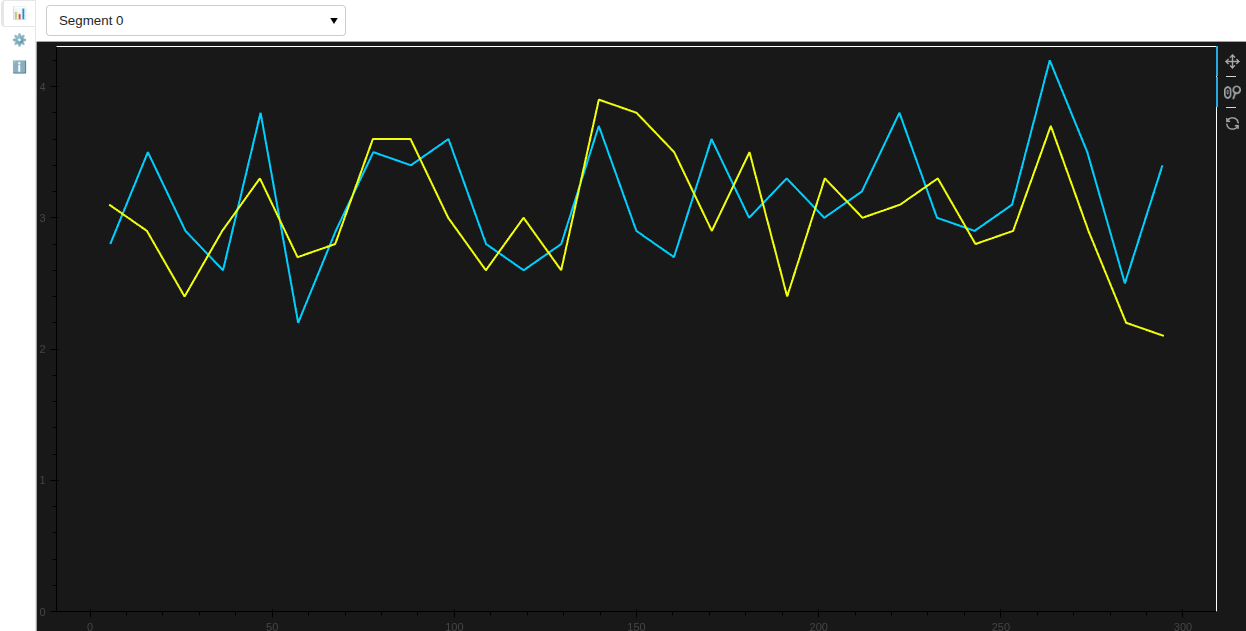
SpikeRateView View
This view shows firing rate for spikes per bin_s.
Screenshots
Desktop (Qt) |
Web (Panel) |
|---|---|
|
|
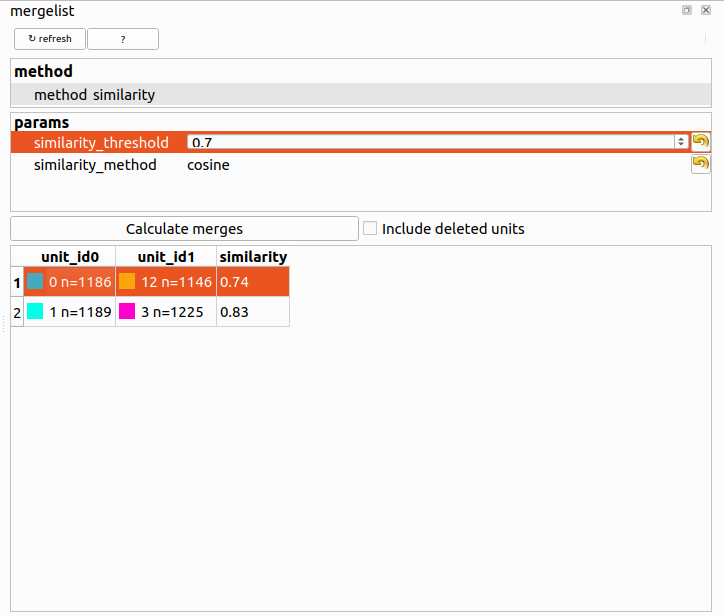
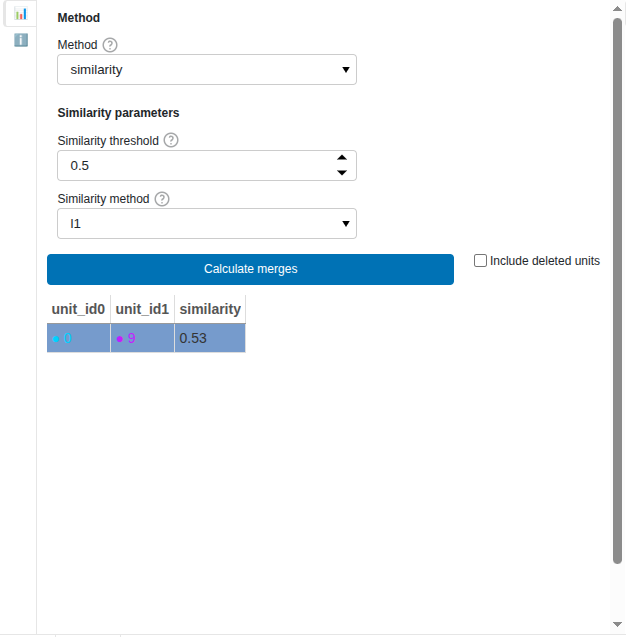
Merge View
This view allows you to compute potential merges between units based on their similarity or using the auto merge function. Select the preset to use for merging units. The available presets are inherited from spikeinterface.
Click “Calculate merges” to compute the potential merges. When finished, the table will be populated with the potential merges.
Controls
left click : select a potential merge group
arrow up/down : navigate through the potential merge groups
ctrl + a : accept the selected merge group
Screenshots
Desktop (Qt) |
Web (Panel) |
|---|---|
|
|
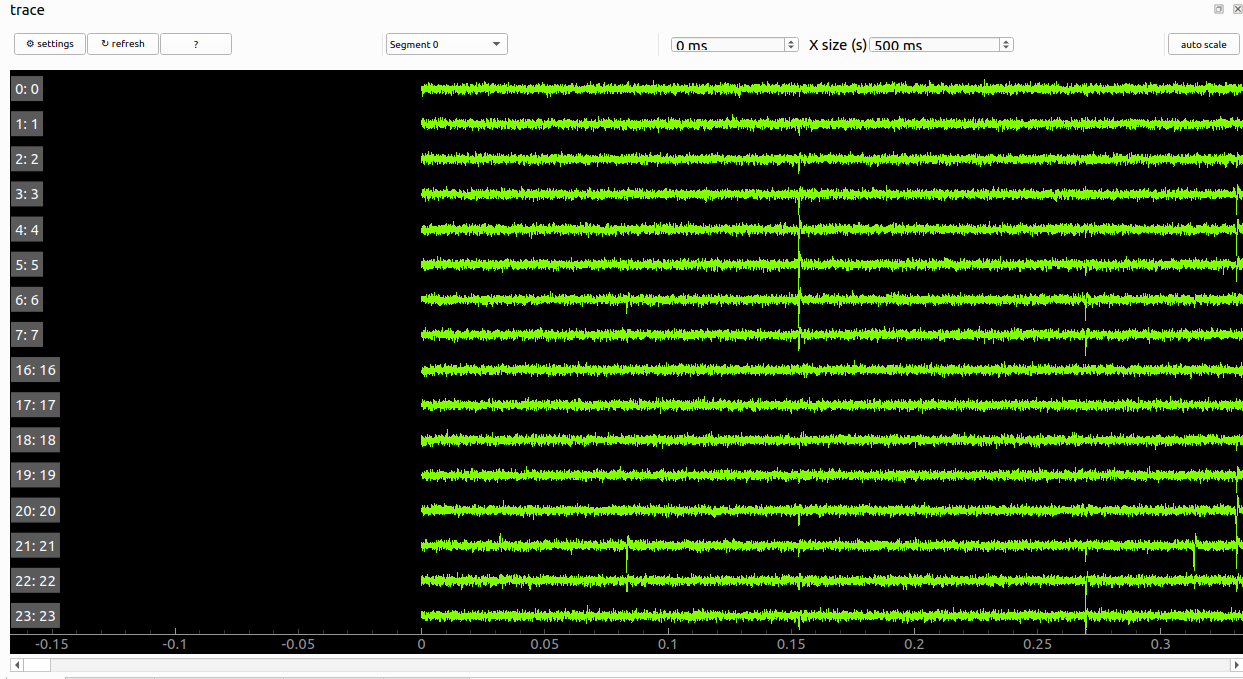
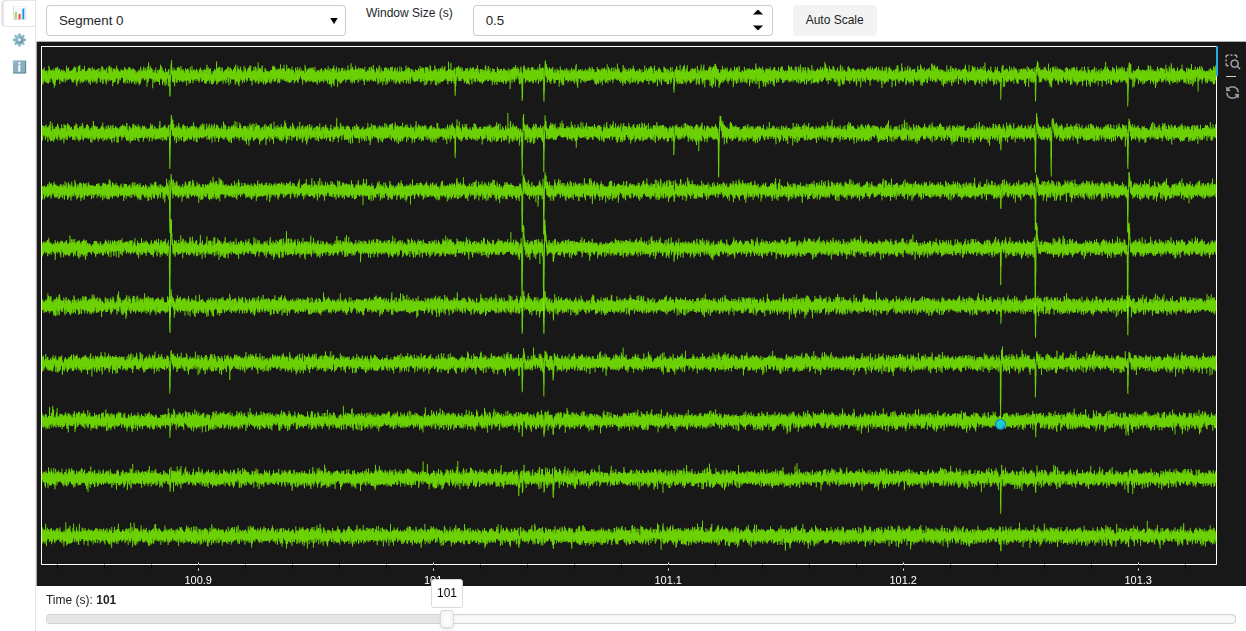
Trace View
This view shows the traces of the selected visible channels from the Probe View.
Controls
x size (s): Set the time window size for the traces.
auto scale: Automatically adjust the scale of the traces.
time (s): Set the time point to display traces.
mouse wheel: change the scale of the traces.
double click: select the nearest spike and center the view on it.
Screenshots
Desktop (Qt) |
Web (Panel) |
|---|---|
|
|
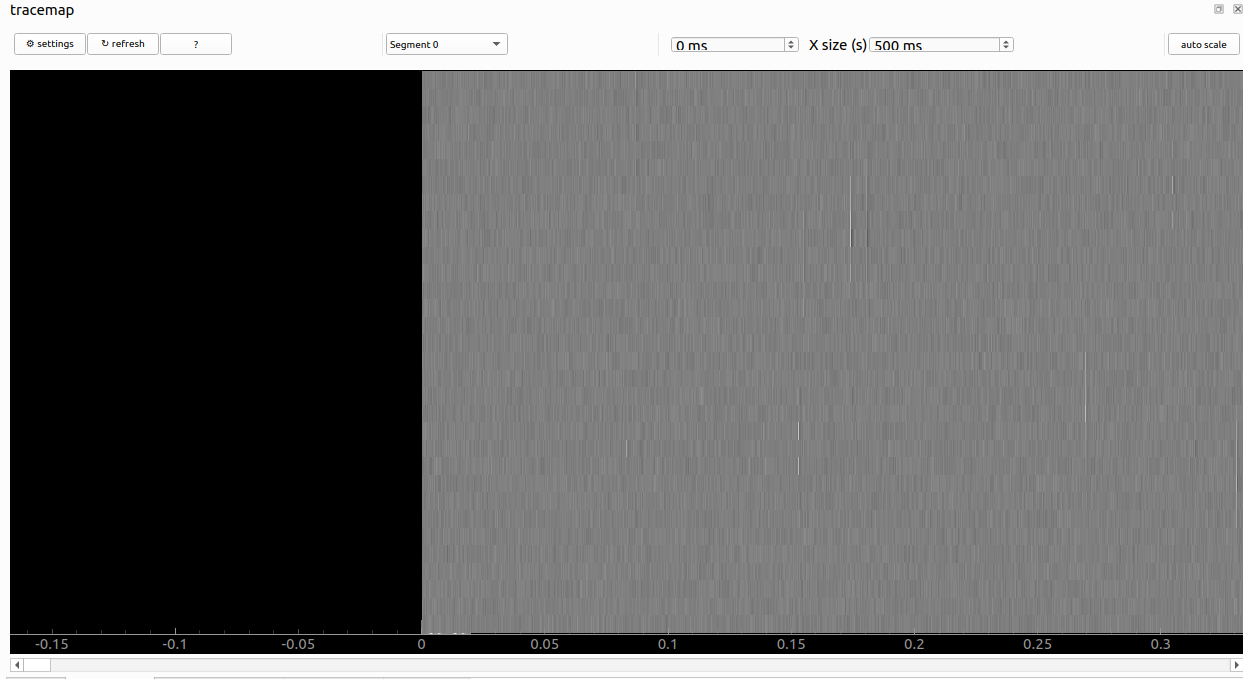
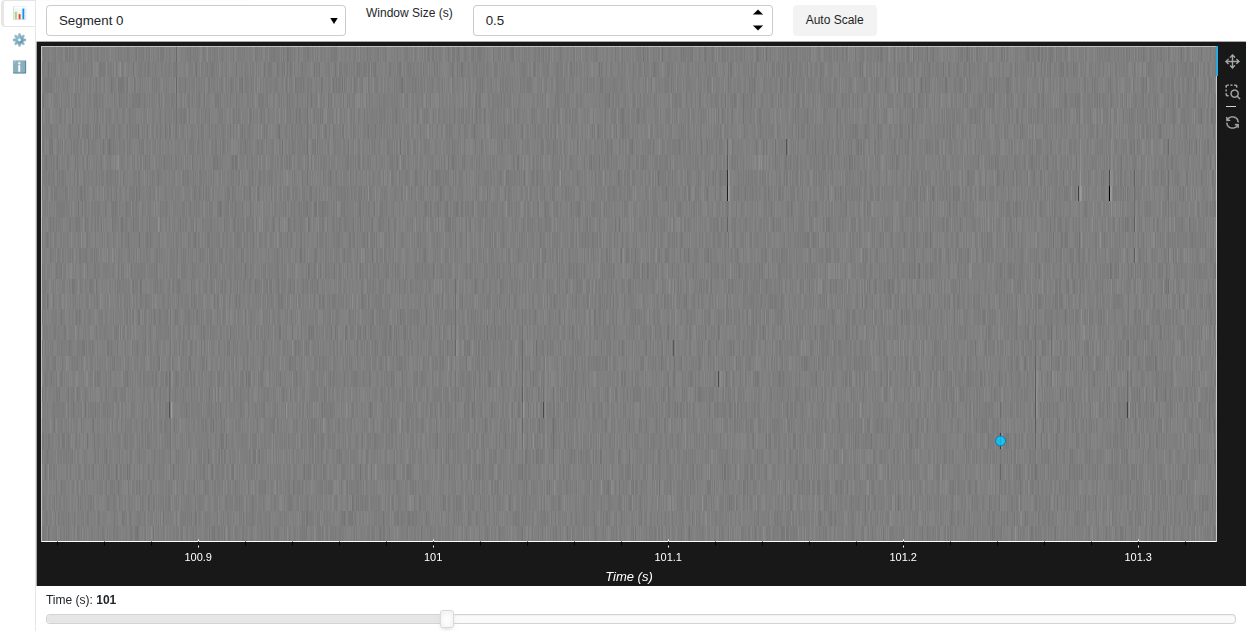
Trace Map View
This view shows the trace map of all the channels.
Controls
x size (s): Set the time window size for the traces.
auto scale: Automatically adjust the scale of the traces.
time (s): Set the time point to display traces.
mouse wheel: change the scale of the traces.
double click: select the nearest spike and center the view on it.
Screenshots
Desktop (Qt) |
Web (Panel) |
|---|---|
|
|
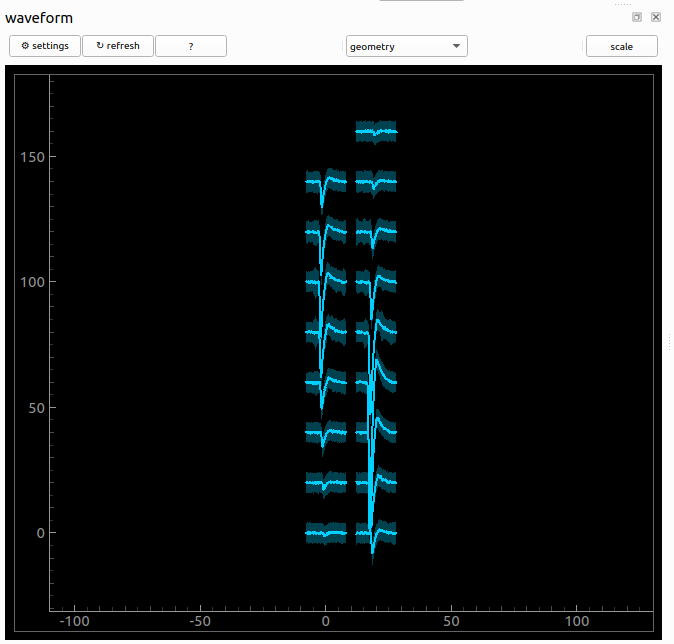
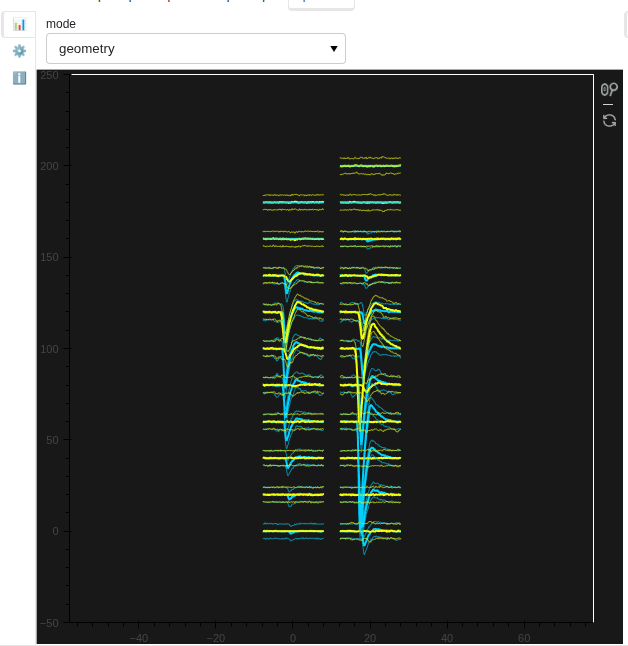
Waveform View
Display average template for visible units. If one spike is selected (in spike list) then the spike is super-imposed (white trace) (when the ‘plot_selected_spike’ setting is True)
There are 2 modes of display: - ‘geometry’ : snippets are displayed centered on the contact position - ‘flatten’ : snippets are concatenated in a flatten way (better to check the variance)
Controls
mode : change displaye mode (geometry or flatten)
ctrl + o : toggle overlap mode
ctrl + p : toggle plot waveform samples
mouse wheel : scale waveform amplitudes
alt + mouse wheel : widen/narrow x axis
shift + mouse wheel : zoom
shift + alt + mouse wheel : scale vertical spacing between channels
Screenshots
Desktop (Qt) |
Web (Panel) |
|---|---|
|
|
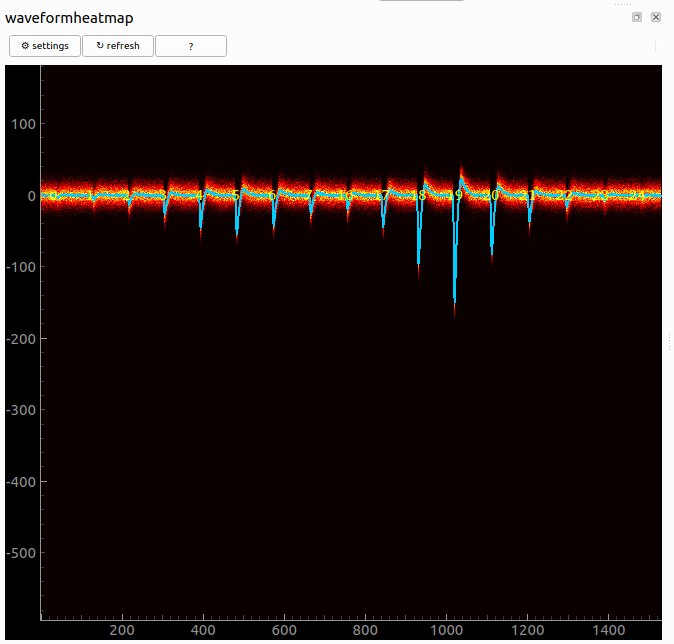
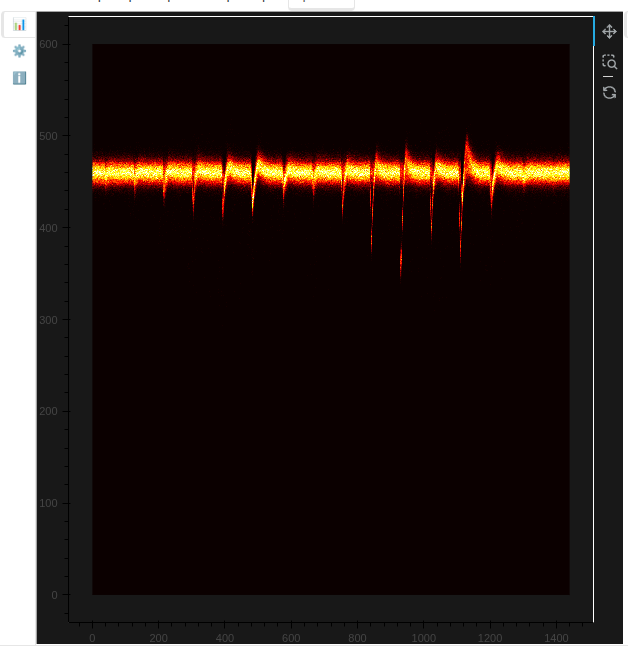
Waveform Heatmap View
Check density around the average template for each unit, which is useful to check overlap between units. For efficiency, no more than 4 units visible at same time. This can be changed in the settings.
Controls
mouse wheel : color range for density (important!!)
right click : X/Y zoom
left click : move
Screenshots
Desktop (Qt) |
Web (Panel) |
|---|---|
|
|
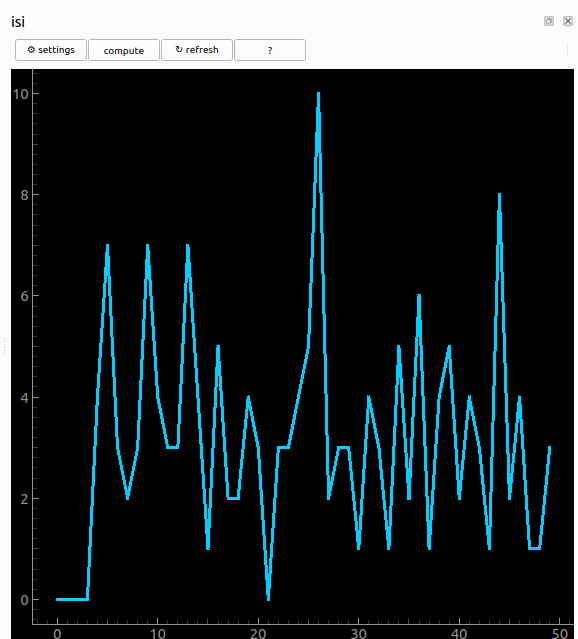
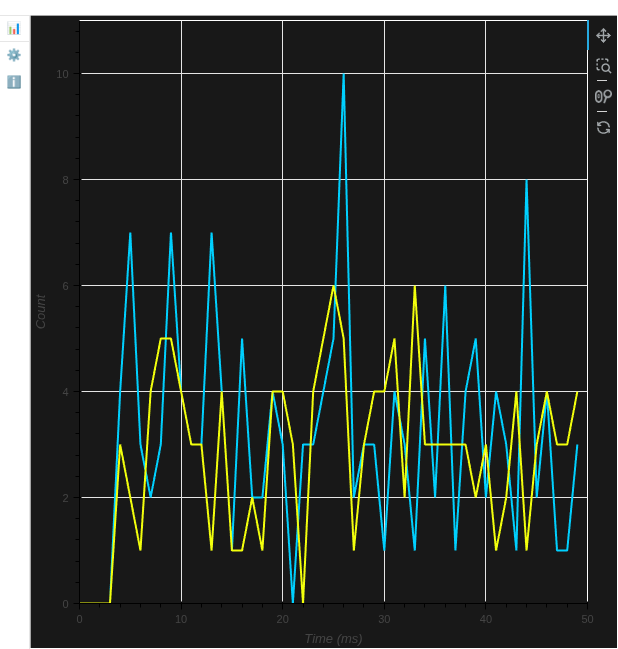
ISI View
This view shows the inter spike interval histograms for each unit.
Screenshots
Desktop (Qt) |
Web (Panel) |
|---|---|
|
|
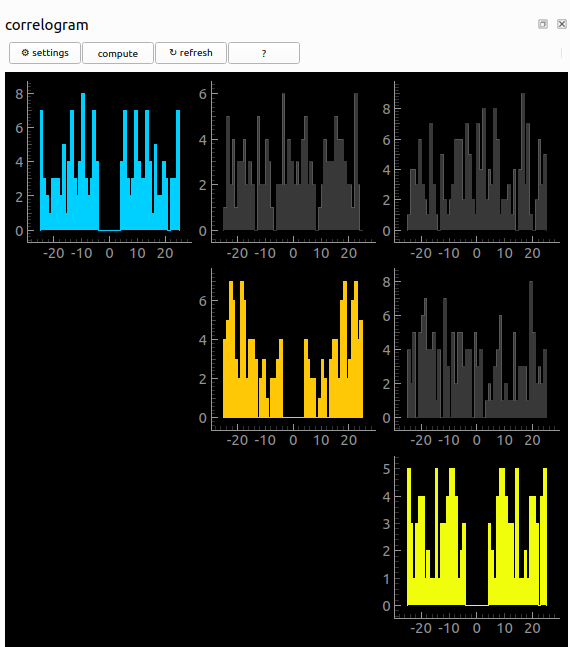
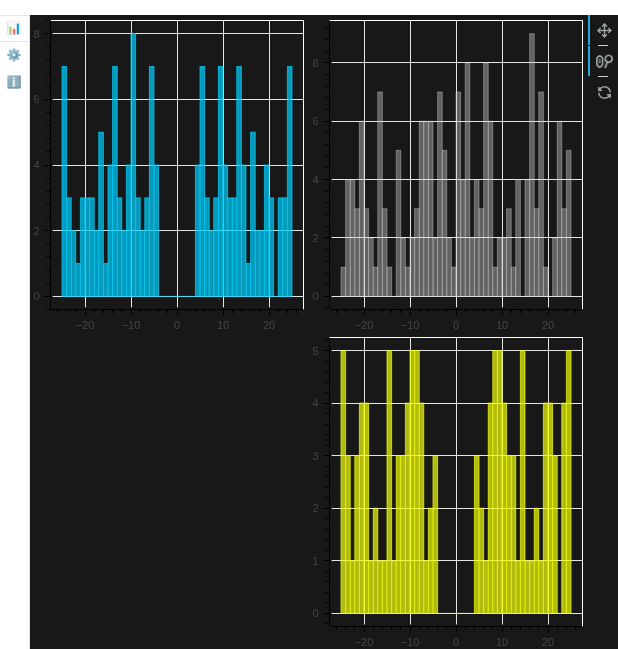
Correlograms View
This view shows the auto-correlograms and cross-correlograms of the selected units.
Screenshots
Desktop (Qt) |
Web (Panel) |
|---|---|
|
|
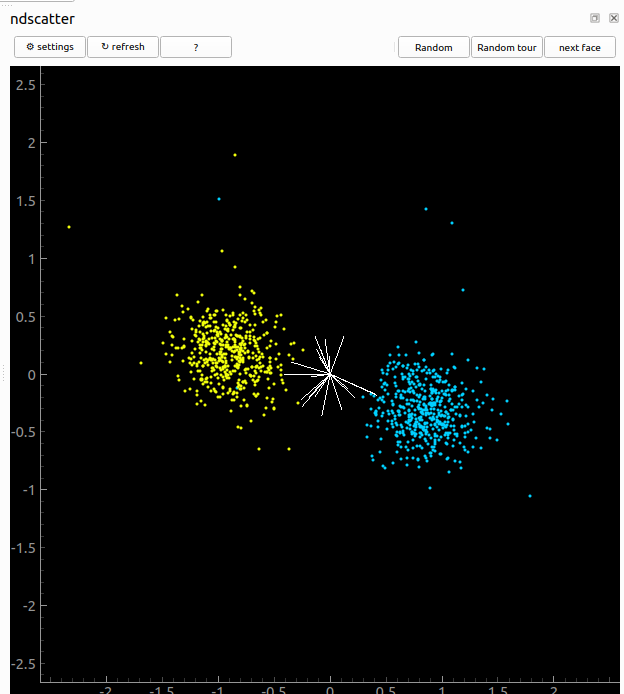
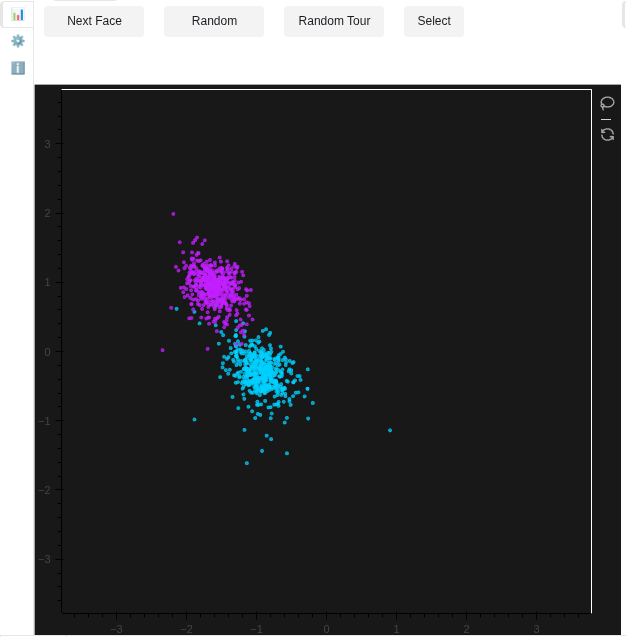
N-dimensional Scatter View
This view projects n-dimensional principal components (num channels x num components) of the selected units in a 2D sub-space.
Controls
next face : rotates the projection
random : randomly choose a projection
random tour : runs dynamic “tour” of the pcs
Screenshots
Desktop (Qt) |
Web (Panel) |
|---|---|
|
|
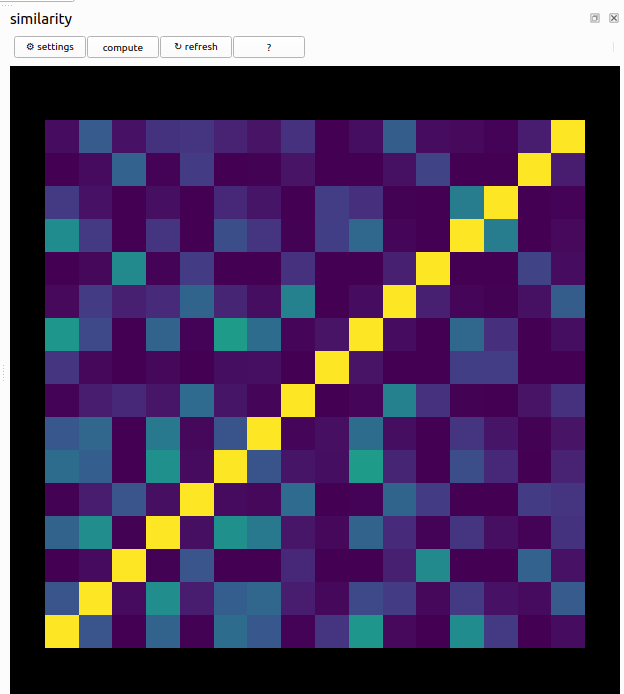
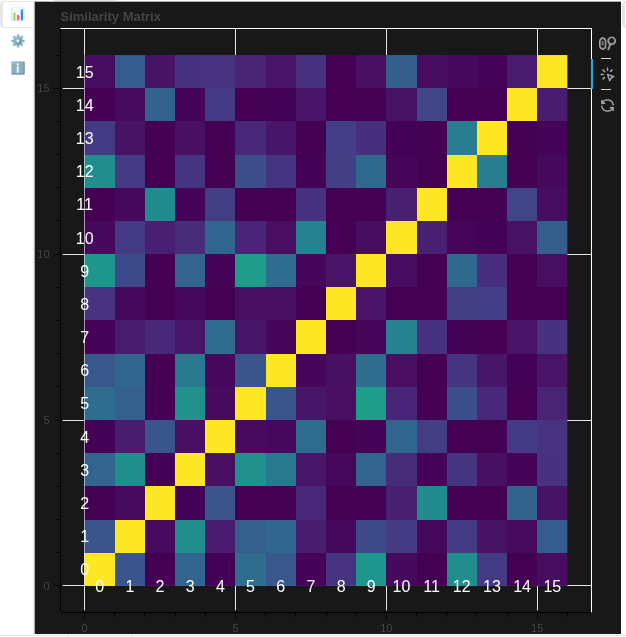
Similarity View
This view displays the template similarity matrix between units.
Controls
left click : select a pair of units to show in the unit view.
Screenshots
Desktop (Qt) |
Web (Panel) |
|---|---|
|
|
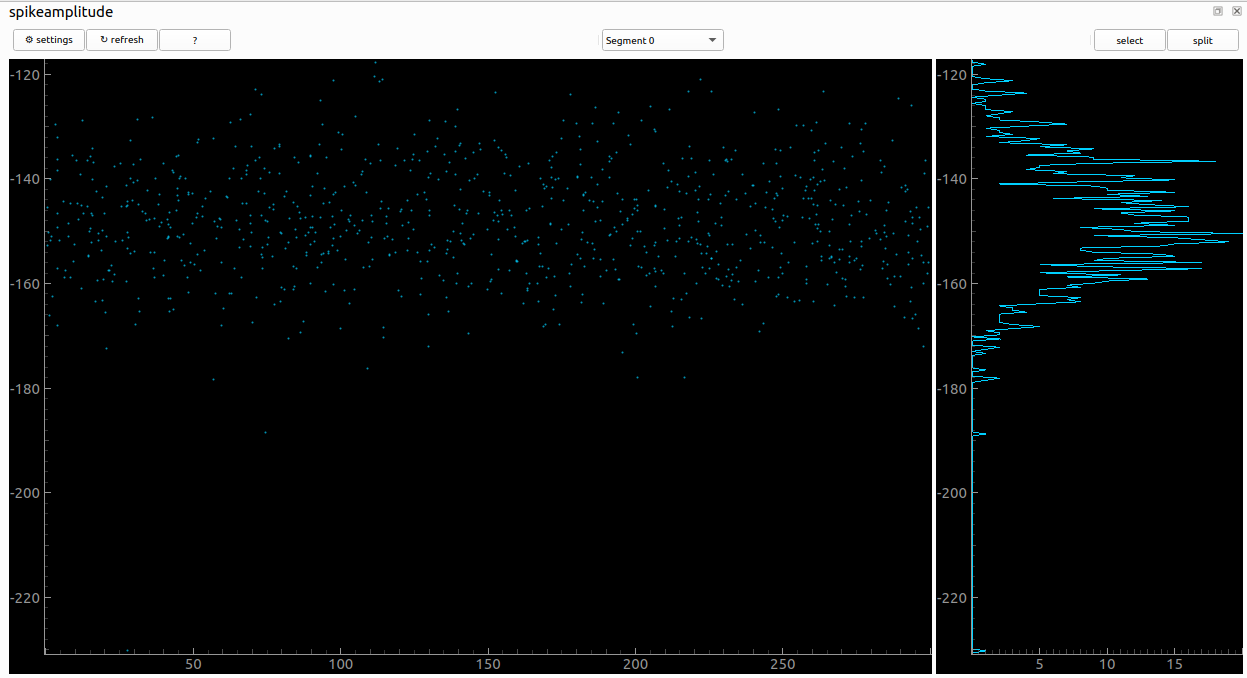
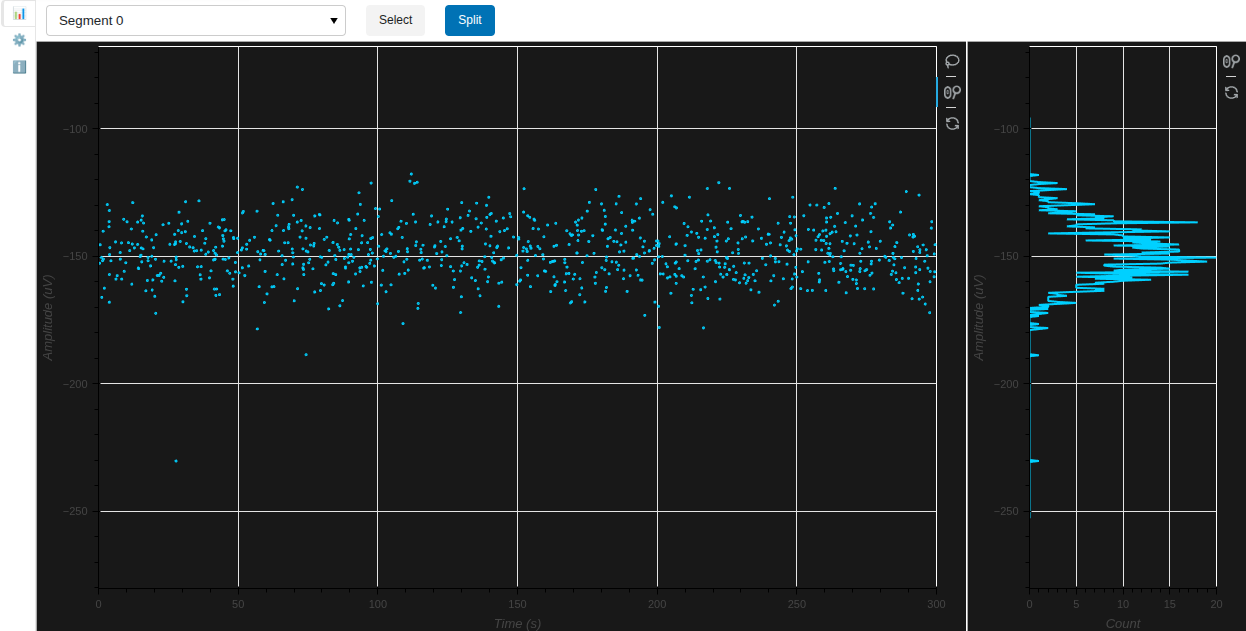
Spike Amplitude View
Check amplitudes of spikes across the recording time or in a histogram comparing the distribution of ampltidues to the noise levels.
Controls
select : activate lasso selection to select individual spikes
split or ctrl+s : split the selected spikes into a new unit (only if one unit is visible)
Screenshots
Desktop (Qt) |
Web (Panel) |
|---|---|
|
|
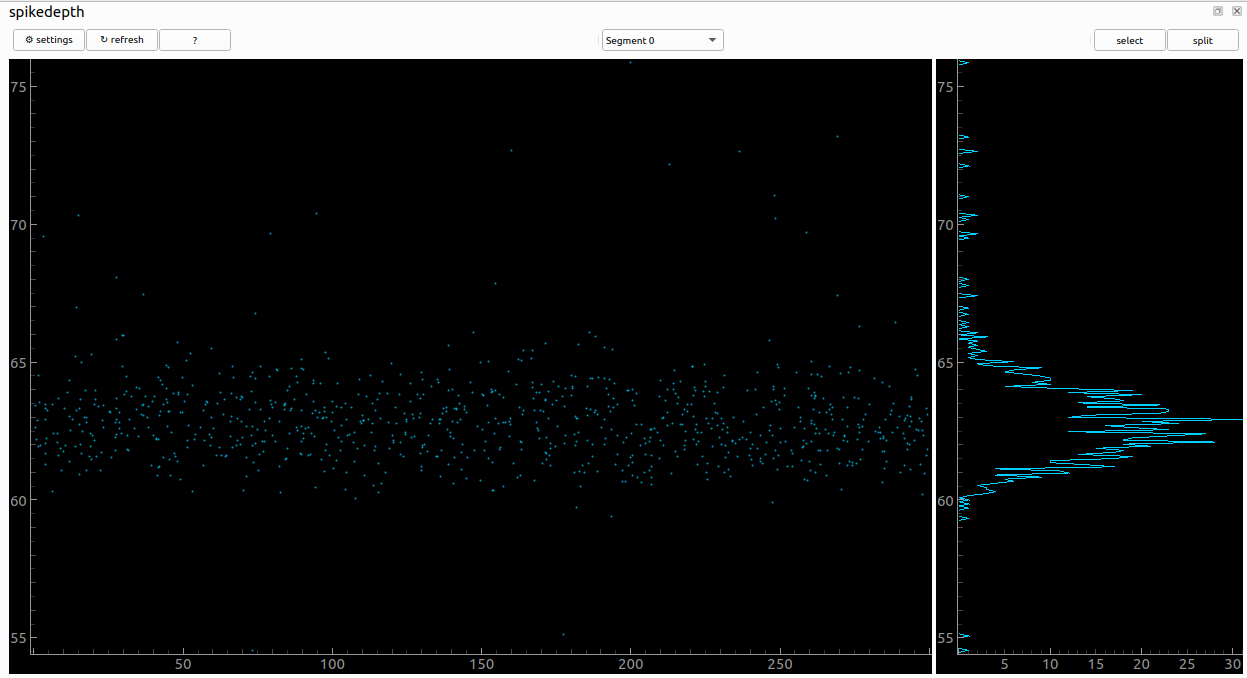
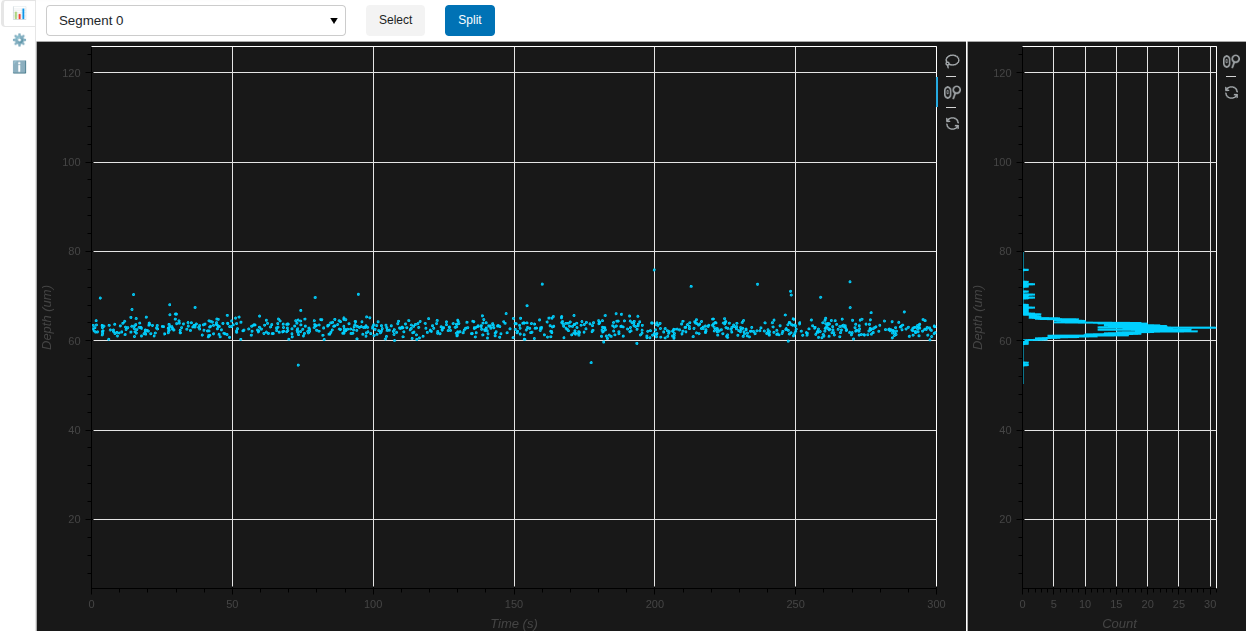
Spike Depth View
Check deppth of spikes across the recording time or in a histogram.
Controls
select : activate lasso selection to select individual spikes
split or ctrl+s : split the selected spikes into a new unit (only if one unit is visible)
Screenshots
Desktop (Qt) |
Web (Panel) |
|---|---|
|
|
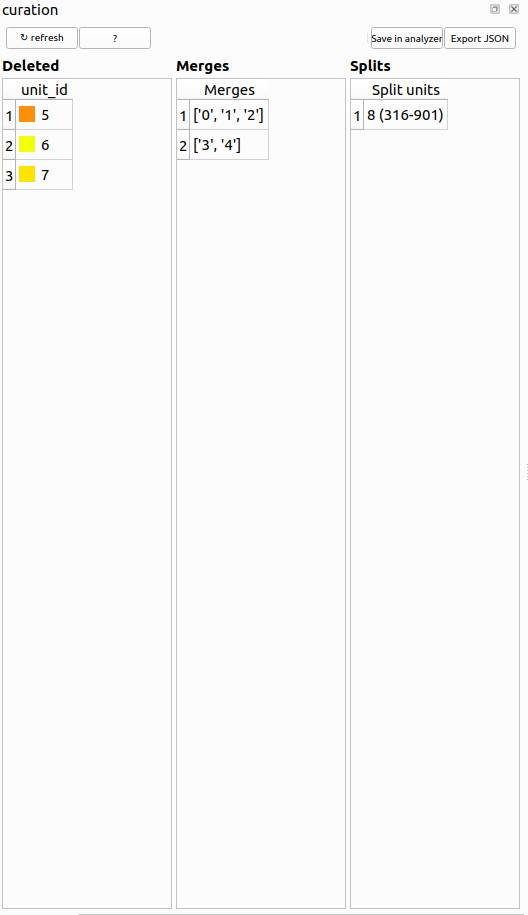
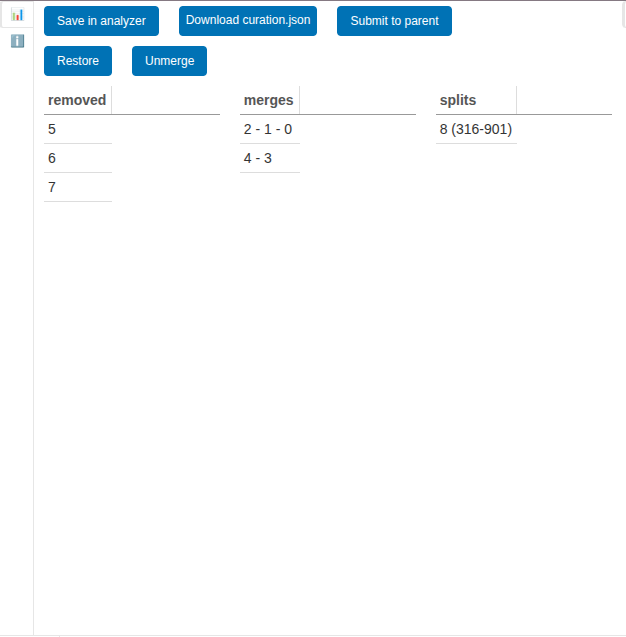
Curation View
The curation view shows the current status of the curation process and allows the user to manually visualize, revert, and export the curation data.
Controls
save in analyzer: Save the current curation state in the analyzer.
export/download JSON: Export the current curation state to a JSON file.
restore: Restore the selected unit from the deleted units table.
unmerge: Unmerge the selected merges from the merged units table.
submit to parent: Submit the current curation state to the parent window (for use in web applications).
press ‘ctrl+r’: Restore the selected units from the deleted units table.
press ‘ctrl+u’: Unmerge the selected merges from the merged units table.
press ‘ctrl+x’: Unsplit the selected split groups from the split units table.
Screenshots
Desktop (Qt) |
Web (Panel) |
|---|---|
|
|
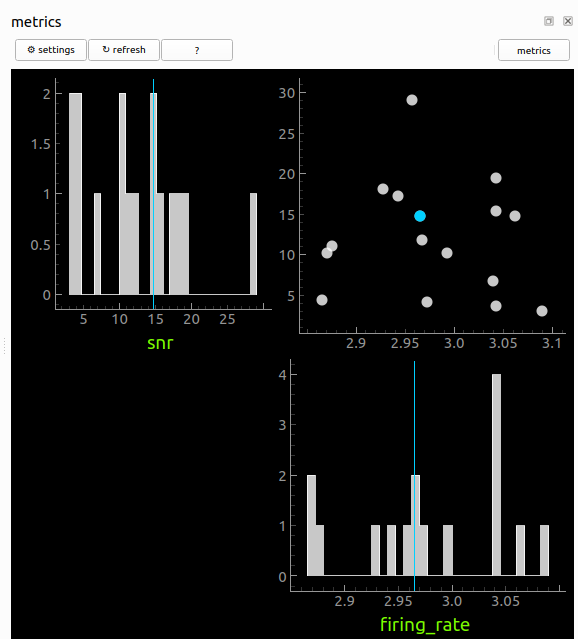
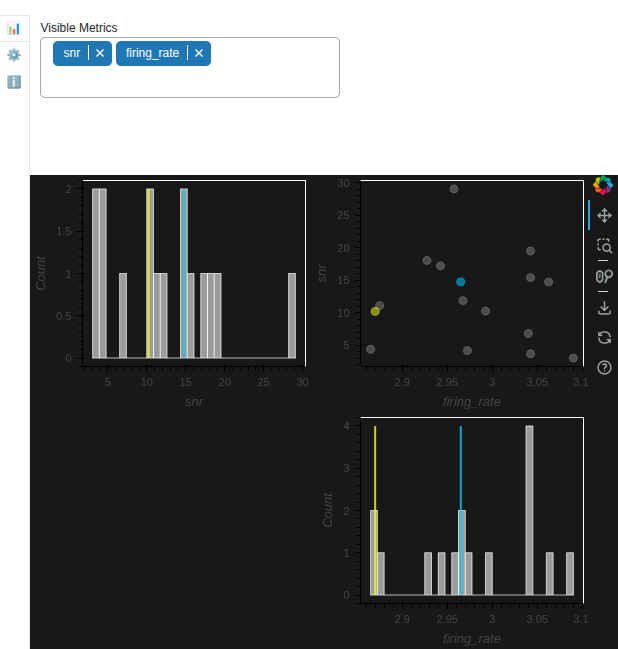
Metrics View
View and explore unit metrics in a customizable grid of plots.
Screenshots
Desktop (Qt) |
Web (Panel) |
|---|---|
|
|
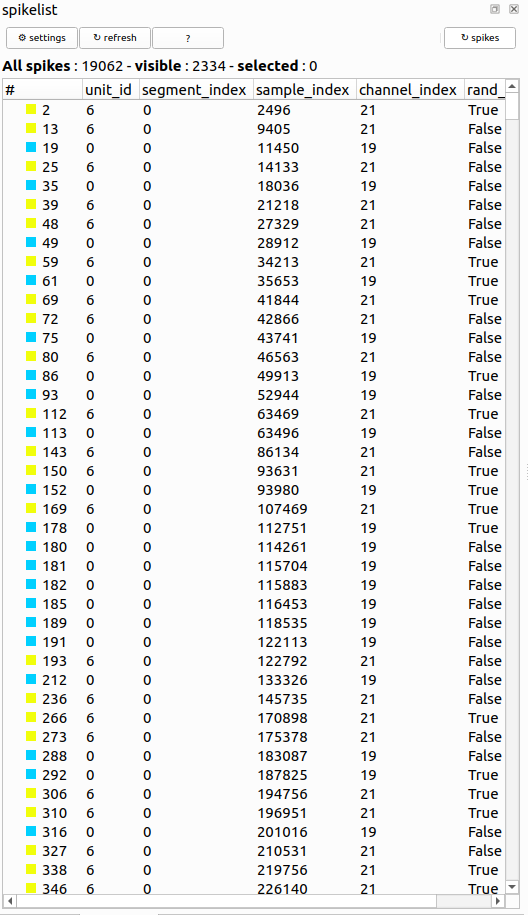
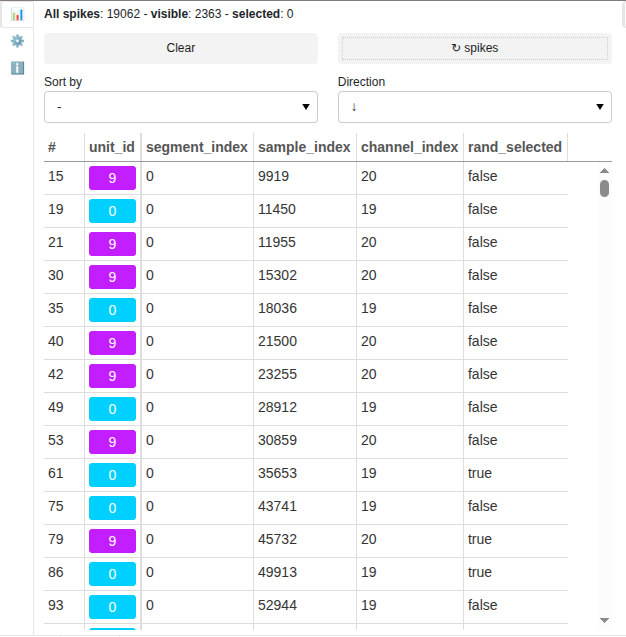
Spike list View
Show all spikes of the visible units. When spikes are selected, they are highlighted in the Spike Amplitude View and the ND SCatter View. When a single spike is selected, the Trace and TraceMap Views are centered on it.
Controls
↻ spikes: refresh the spike list
clear: clear the selected spikes
shift + arrow up/down : select next/previous spike and make it visible alone
Screenshots
Desktop (Qt) |
Web (Panel) |
|---|---|
|
|
Amplitude Scalings View
Amplitude scalings measure the optimal scaling which should be applied to the template so that it best matches each spike waveform.
Controls
select : activate lasso selection to select individual spikes
split or ctrl+s : split the selected spikes into a new unit (only if one unit is visible)
Screenshots not available for this view.
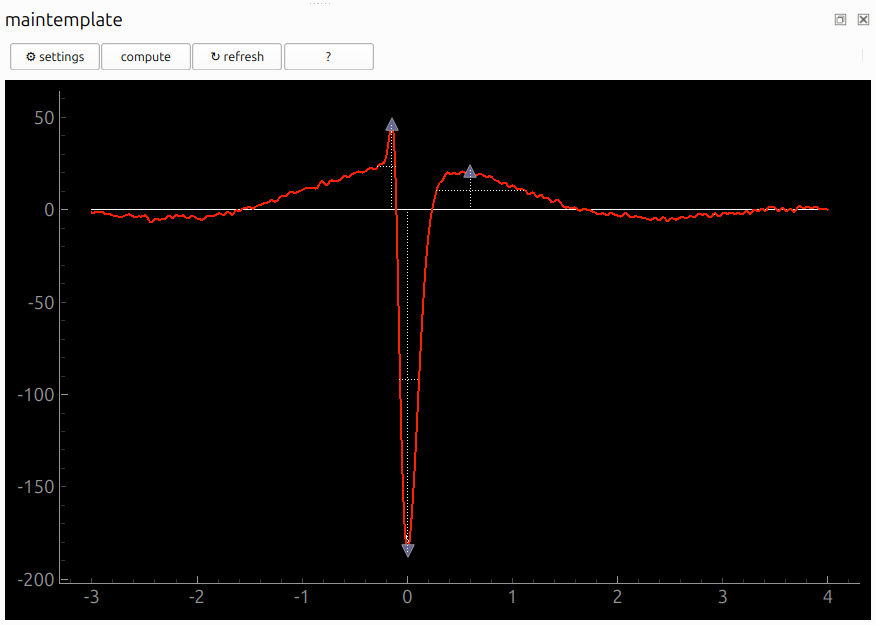
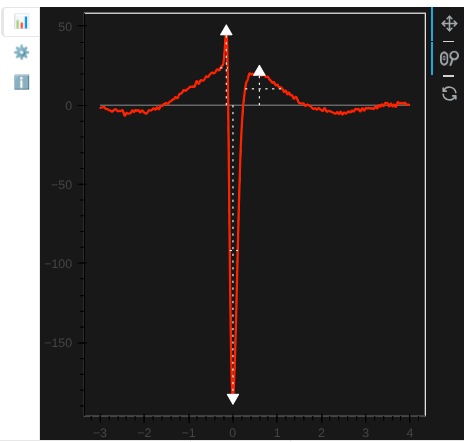
Main Template View
Display average template on main channel. If the template_metrics are computed, it also displayed the template signal used to compute metrics (usually upsampled) and the trough/peak_before/peak_after positions and widths.
troughs are negative extrema and are displayed with a downward triangle symbol
peaks are positive extrema and are displayed with an upward triangle symbol
Screenshots
Desktop (Qt) |
Web (Panel) |
|---|---|
|
|